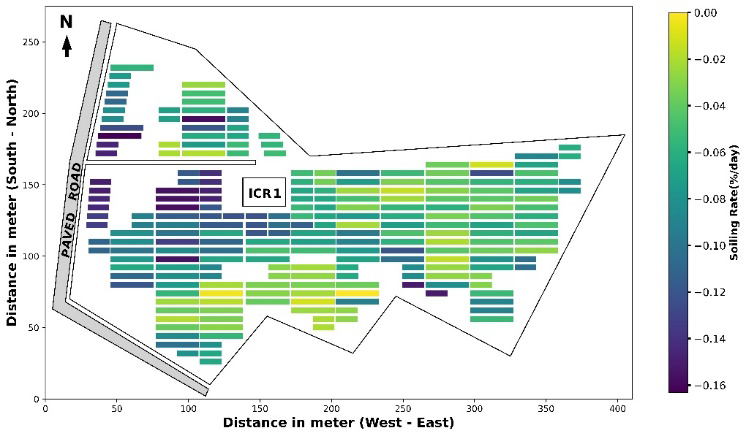


Photovoltaic (PV) soiling loss refers to the buildup of dust particles on the PV system surface, which reduces power generation with time and results in significant financial losses. Utility-scale PV plants are spread across a wide area, resulting in the spatial variation of soil deposition on the PV strings. This requires more frequent cleaning of the PV strings experiencing high soiling. Though non-uniform soiling is a well-known concept, it has been relatively less explored. Shoubhik De, a PhD student with NCPRE, has been working on PV soiling loss under the guidance of professors Narendra Shiradkar and Anil Kottantharayil. To quantify the soiling loss, the researchers analysed PV string-level SCADA data of a utility-scale PV plant in south India. The PV plant was divided into 15 zones, from which A, D, and I were investigated. Using the string-level SCADA data, the researchers developed PV soiling maps that enabled them to identify the areas of the plant experiencing soiling non-uniformity. This information would be valuable to the plant O&M team, as it will help them regularly clean the strings experiencing high soiling. The information on non-uniform soiling for each zone was then used to develop optimised cleaning schedules for the plant. The researchers proposed a new cleaning methodology known as zone-optimised cleaning, where every zone is cleaned based on the soiling level of the highest soiled string of that zone. This methodology shall enable the O&M team to clean all the strings of a zone on the same day as the highest soiled string, thereby overcoming the shortcomings of string-optimised cleaning proposed by previous researchers and saving resources. The methodology helps generate high cleaning profits and maintains the overall plant yield. This work has been published and is now available online in Elsevier's Solar Energy journal. The title of the paper is "Estimation of non-uniform soiling loss in a utility-scale PV plant in India and strategies for enhanced performance through optimal cleaning schedules" and can be accessed at: https://doi.org/10.1016/j.solener.2025.113345

Soiling map of zone D, showing the geographical distribution of different strings and the soiling rates (coloured scale bar on the right). Each rectangular box represents a PV string, with the larger box indicating a string comprising 60 modules. The smaller, adjacent boxes (together forming a string), each half the length of the larger one, represent strings comprising 30 modules.